After discussing the financial theory behind optimal capital structure and the influences of macroeconomic factors, we would now like to share our findings in regards to changes in capital structure during the 2008 financial crisis. Specifically, we examined the total market and the individual industries for both the United States and the United Kingdom. Our sample period is 2006-2011, which we then divided equally into three parts: Pre-Crisis (06-07’), Crisis Period (08-09’), and Post-Crisis (10-11’). The two dependent variables we chose to observe were leverage (Total Debt/Total Assets) and long-term leverage (LT Debt/Total Debt). Additionally, we tested six other variables using a univariate regression consisting of firm size, market-to-book, profitability, tangibility, non-debt tax shield (NDTS), and growth.
Our results showed that tangibility had the highest explanatory power on the use of leverage for firms in both the US and UK. Our regression results also showed that in the UK, market-to-book and NDTS were important determinants, while in the US it was NDTS and profitability with the highest explanatory power. After this we did a similar regression to test for significance on long-term leverage and found that in the UK, firm size and profitability had the highest explanatory power, where in the US, market-to-book, firm size, and profitability explain the majority of the dispersion. Next we examined total leverage in the US and the UK over the same time period, the results for which are provided in the graph below.
Leverage US & UK
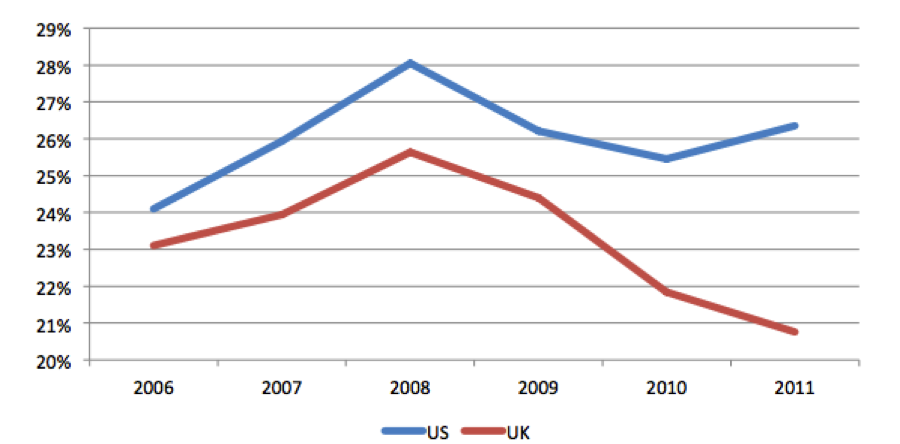
The graph shows that in the pre-crisis period firms, on average, were increasing their leverage up until its peak in 2008, where we see a substantial reduction in leverage during the crisis period. Lastly, we see a divergence in the post-crisis period between the two countries. The US begins to once again gradually increase leverage, while the UK shows an even more drastic decrease in leverage.
Lastly, we observed changes in leverage ratios for the individual industries within each country. We failed to find significant changes in leverage ratios for any of the industries at an alpha level of .05. What we did found instead is large gaps between the industries within each country, and large differences in the same industries between countries. For instance, the US telecommunications industry had a leverage ratio of 48% while the technology industry only had a leverage ratio of 13%. In terms of differences between countries, the same the telecommunications industry in the UK had a leverage ratio of only 28%, which is much lower than its US counterpart. This is consistent with the results found in Graham and Leary (2011), who found financial leverage varies more within industries than within firms over time. Our findings show that leverage ratios were effected by both macroeconomic and industry-specific factors within the country.


